
Description
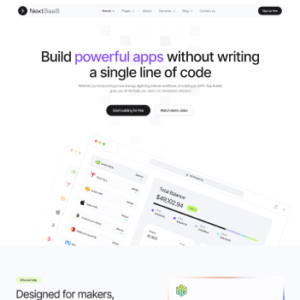
Data Visualization Platform
Understand your business data more clearly with our Data Visualization Platform. It helps organizations convert complex data into simple and interactive visual reports.
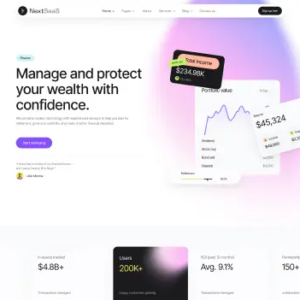
The platform allows businesses to create dashboards, charts, and graphs that make data easier to read and analyze. As a result, teams can quickly identify trends, patterns, and valuable insights.
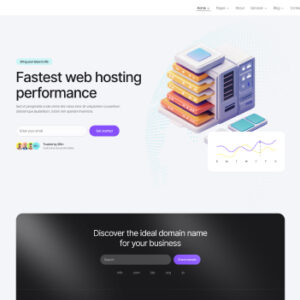
In addition, the platform supports real-time data monitoring. This helps businesses track performance metrics and make faster decisions based on accurate information.
Furthermore, the system integrates easily with multiple data sources such as databases, business applications, and cloud platforms. This ensures that all your data can be visualized in one centralized dashboard.
Key Features
Interactive Dashboards
Create dynamic dashboards that present business data in a clear and visual format.
Advanced Data Analytics
Analyze large datasets and discover patterns, trends, and valuable insights.
Custom Charts & Graphs
Visualize data using different chart types including bar charts, line graphs, and pie charts.
Real-Time Data Monitoring
Track important metrics and business performance instantly.
Data Integration
Connect data from multiple sources such as databases, applications, and cloud platforms.
Secure & Scalable Platform
Built with strong security and designed to support growing business needs.
Why Choose Our Data Visualization Platform
Our platform helps businesses make better decisions using clear and visual insights. Instead of analyzing complex spreadsheets, teams can quickly understand performance through interactive dashboards.
Moreover, the platform improves collaboration across teams. Everyone can access the same visual data and work with accurate information.
Whether you want to monitor business performance, analyze customer trends, or generate reports, our Data Visualization Platform provides the tools needed to transform data into actionable insights.

Reviews
There are no reviews yet.